What does data look like#
What libraries should I import?#
import pandas as pd
import numpy as np
import matplotlib.pyplot as plt
How to read data?#
Dummy data for the following exercises is provided here.
file = '/Users/guillermo/Downloads/pose-3d.csv'
data = pd.read_csv(file, header=0)
How is my data structured?#
data.info()
<class 'pandas.core.frame.DataFrame'>
RangeIndex: 450 entries, 0 to 449
Columns: 139 entries, lefteye1_x to fnum
dtypes: float64(138), int64(1)
memory usage: 488.8 KB
np.shape(data)
(450, 139)
data
| lefteye1_x | lefteye1_y | lefteye1_z | lefteye1_error | lefteye1_ncams | lefteye1_score | lefteye2_x | lefteye2_y | lefteye2_z | lefteye2_error | ... | M_10 | M_11 | M_12 | M_20 | M_21 | M_22 | center_0 | center_1 | center_2 | fnum | |
|---|---|---|---|---|---|---|---|---|---|---|---|---|---|---|---|---|---|---|---|---|---|
| 0 | -11.488100 | -0.391982 | -6.391103 | 1.938121 | 2.0 | 0.999995 | 14.093313 | -1.432060 | -1.898372 | 2.190833 | ... | 0.025309 | 0.004592 | 0.999669 | -0.155911 | -0.987735 | 0.008484 | 136.712949 | 21.796899 | 59.925219 | 0 |
| 1 | -11.563727 | -0.248620 | -6.538817 | 2.030270 | 2.0 | 0.999996 | 14.219575 | -1.263471 | -2.031282 | 1.935011 | ... | 0.025309 | 0.004592 | 0.999669 | -0.155911 | -0.987735 | 0.008484 | 136.712949 | 21.796899 | 59.925219 | 1 |
| 2 | -11.630087 | -0.129231 | -6.667193 | 1.802676 | 2.0 | 0.999997 | 14.361094 | -1.127249 | -2.146595 | 1.606363 | ... | 0.025309 | 0.004592 | 0.999669 | -0.155911 | -0.987735 | 0.008484 | 136.712949 | 21.796899 | 59.925219 | 2 |
| 3 | -11.666934 | -0.057356 | -6.765140 | 2.019693 | 2.0 | 0.999998 | 14.528884 | -1.018296 | -2.235377 | 1.527383 | ... | 0.025309 | 0.004592 | 0.999669 | -0.155911 | -0.987735 | 0.008484 | 136.712949 | 21.796899 | 59.925219 | 3 |
| 4 | -11.657633 | -0.022595 | -6.825935 | 2.186289 | 2.0 | 0.999998 | 14.727834 | -0.916615 | -2.290928 | 1.662191 | ... | 0.025309 | 0.004592 | 0.999669 | -0.155911 | -0.987735 | 0.008484 | 136.712949 | 21.796899 | 59.925219 | 4 |
| ... | ... | ... | ... | ... | ... | ... | ... | ... | ... | ... | ... | ... | ... | ... | ... | ... | ... | ... | ... | ... | ... |
| 445 | 19.858564 | -0.186870 | 3.376668 | 1.879663 | 2.0 | 1.000000 | 43.138611 | -0.935498 | 6.239373 | 2.397886 | ... | 0.025309 | 0.004592 | 0.999669 | -0.155911 | -0.987735 | 0.008484 | 136.712949 | 21.796899 | 59.925219 | 445 |
| 446 | 19.828282 | -0.197882 | 3.399467 | 1.926345 | 2.0 | 1.000000 | 43.099870 | -0.936545 | 6.289830 | 2.507487 | ... | 0.025309 | 0.004592 | 0.999669 | -0.155911 | -0.987735 | 0.008484 | 136.712949 | 21.796899 | 59.925219 | 446 |
| 447 | 19.792748 | -0.197968 | 3.419085 | 1.987387 | 2.0 | 1.000000 | 43.070633 | -0.924082 | 6.339649 | 2.495454 | ... | 0.025309 | 0.004592 | 0.999669 | -0.155911 | -0.987735 | 0.008484 | 136.712949 | 21.796899 | 59.925219 | 447 |
| 448 | 19.753271 | -0.185416 | 3.436065 | 1.666125 | 2.0 | 1.000000 | 43.049360 | -0.899445 | 6.388871 | 2.244805 | ... | 0.025309 | 0.004592 | 0.999669 | -0.155911 | -0.987735 | 0.008484 | 136.712949 | 21.796899 | 59.925219 | 448 |
| 449 | 19.712078 | -0.173427 | 3.453072 | 1.993099 | 2.0 | 1.000000 | 43.030381 | -0.879919 | 6.437327 | 2.190697 | ... | 0.025309 | 0.004592 | 0.999669 | -0.155911 | -0.987735 | 0.008484 | 136.712949 | 21.796899 | 59.925219 | 449 |
450 rows × 139 columns
Cleaning data#
coords = data.loc[:, ~data.columns.str.contains(
    'score|error|ncams|fnum|center|M_')]
scores = data.loc[:, data.columns.str.contains('score')]
Changing the data structure#
# Let us transform the data to be centered around a reference point
centered_coords = coords.copy()
for i in range(centered_coords.shape[1]):
    if '_x' in centered_coords.columns[i]:
        centered_coords.loc[:, centered_coords.columns[i]] = centered_coords.loc[:,
                                                                                 centered_coords.columns[i]].subtract(coords.loc[:, "nose1_x"].values)
    elif '_y' in centered_coords.columns[i]:
        centered_coords.loc[:, centered_coords.columns[i]] = centered_coords.loc[:,
                                                                                 centered_coords.columns[i]].subtract(coords.loc[:, "nose1_y"].values)
    elif '_z' in centered_coords.columns[i]:
        centered_coords.loc[:, centered_coords.columns[i]] = centered_coords.loc[:,
                                                                                 centered_coords.columns[i]].subtract(coords.loc[:, "nose1_z"].values)
    else:
        pass
centered_coords
| lefteye1_x | lefteye1_y | lefteye1_z | lefteye2_x | lefteye2_y | lefteye2_z | righteye1_x | righteye1_y | righteye1_z | righteye2_x | ... | lowlip_z | llip_x | llip_y | llip_z | rlip_x | rlip_y | rlip_z | chin_x | chin_y | chin_z | |
|---|---|---|---|---|---|---|---|---|---|---|---|---|---|---|---|---|---|---|---|---|---|
| 0 | 21.138248 | 0.149274 | 1.339277 | 46.719661 | -0.890804 | 5.832008 | -22.571980 | -0.471520 | -9.779492 | -37.820867 | ... | -80.979542 | 37.796704 | -0.980286 | -67.807799 | -10.351668 | 1.195690 | -76.963349 | 19.029902 | -0.445000 | -115.416169 |
| 1 | 21.201282 | 0.213704 | 1.322499 | 46.984585 | -0.801147 | 5.830035 | -22.538740 | -0.402639 | -9.909138 | -37.677083 | ... | -80.990478 | 37.855529 | -0.946660 | -67.868614 | -10.338881 | 1.200735 | -76.917438 | 19.053691 | -0.440997 | -115.518292 |
| 2 | 21.256664 | 0.240579 | 1.302346 | 47.247845 | -0.757440 | 5.822944 | -22.508311 | -0.368747 | -10.036418 | -37.536744 | ... | -81.001777 | 37.907243 | -0.940885 | -67.933516 | -10.330400 | 1.193681 | -76.872875 | 19.065735 | -0.449761 | -115.618253 |
| 3 | 21.299285 | 0.240397 | 1.274168 | 47.495103 | -0.720543 | 5.803931 | -22.480971 | -0.356541 | -10.160358 | -37.410751 | ... | -81.009722 | 37.937340 | -0.950328 | -68.005056 | -10.330788 | 1.182822 | -76.827400 | 19.055308 | -0.460424 | -115.710979 |
| 4 | 21.325677 | 0.220319 | 1.235597 | 47.711144 | -0.673701 | 5.770603 | -22.456571 | -0.350904 | -10.279109 | -37.310866 | ... | -81.007437 | 37.939126 | -0.940040 | -68.081264 | -10.349203 | 1.157687 | -76.779312 | 19.016472 | -0.470678 | -115.789328 |
| ... | ... | ... | ... | ... | ... | ... | ... | ... | ... | ... | ... | ... | ... | ... | ... | ... | ... | ... | ... | ... | ... |
| 445 | 23.060752 | -0.199214 | 1.879664 | 46.340798 | -0.947842 | 4.742368 | -19.185499 | 1.345010 | -6.506368 | -41.953663 | ... | -71.425305 | 43.196517 | -0.785810 | -56.866667 | -18.389502 | 1.428511 | -66.358897 | 18.667268 | 0.086065 | -118.640513 |
| 446 | 23.079261 | -0.215957 | 1.892306 | 46.350848 | -0.954620 | 4.782669 | -19.195640 | 1.345283 | -6.492639 | -41.925121 | ... | -71.434948 | 43.233000 | -0.798553 | -56.874906 | -18.308865 | 1.423512 | -66.383337 | 18.711471 | 0.078809 | -118.608907 |
| 447 | 23.092409 | -0.221658 | 1.901226 | 46.370295 | -0.947773 | 4.821791 | -19.207953 | 1.350226 | -6.479757 | -41.894597 | ... | -71.446489 | 43.267756 | -0.816412 | -56.887243 | -18.231429 | 1.421237 | -66.409016 | 18.751617 | 0.062069 | -118.578352 |
| 448 | 23.100727 | -0.215898 | 1.907636 | 46.396815 | -0.929927 | 4.860443 | -19.222547 | 1.355703 | -6.466862 | -41.864912 | ... | -71.458910 | 43.300950 | -0.836934 | -56.901680 | -18.156717 | 1.420305 | -66.434610 | 18.788906 | 0.038433 | -118.547809 |
| 449 | 23.107326 | -0.207480 | 1.914174 | 46.425629 | -0.913972 | 4.898429 | -19.238019 | 1.361772 | -6.453821 | -41.835615 | ... | -71.471432 | 43.332800 | -0.859951 | -56.916573 | -18.082740 | 1.422841 | -66.459968 | 18.825424 | 0.014881 | -118.516762 |
450 rows × 63 columns
# What is the difference between pandas Data Frame and numpy Array?
coords_egocentric = centered_coords.to_numpy()
coords_egocentric
array([[ 2.11382476e+01,  1.49273730e-01,  1.33927693e+00, ...,
         1.90299024e+01, -4.45000140e-01, -1.15416169e+02],
       [ 2.12012820e+01,  2.13704103e-01,  1.32249940e+00, ...,
         1.90536908e+01, -4.40996722e-01, -1.15518292e+02],
       [ 2.12566635e+01,  2.40579034e-01,  1.30234553e+00, ...,
         1.90657352e+01, -4.49760897e-01, -1.15618253e+02],
       ...,
       [ 2.30924089e+01, -2.21658316e-01,  1.90122647e+00, ...,
         1.87516173e+01,  6.20694224e-02, -1.18578352e+02],
       [ 2.31007267e+01, -2.15897713e-01,  1.90763642e+00, ...,
         1.87889064e+01,  3.84331742e-02, -1.18547809e+02],
       [ 2.31073256e+01, -2.07480062e-01,  1.91417434e+00, ...,
         1.88254245e+01,  1.48810149e-02, -1.18516762e+02]])
Reading DeepLabCut Data#
Note that DeepLabCut files contain multiple headers
# .h5 vs csv with multiple headings
file = '/Users/guillermo/Downloads/DLC_data.csv'
data = pd.read_csv(file, header=0)
data
/Users/guillermo/opt/anaconda3/lib/python3.8/site-packages/IPython/core/interactiveshell.py:3444: DtypeWarning: Columns (0,1,2,3,4,5,6,7,8,9,10,11,12,13,14,15,16,17,18) have mixed types.Specify dtype option on import or set low_memory=False.
  exec(code_obj, self.user_global_ns, self.user_ns)
| scorer | DLC_resnet50_Picky_Pigeon_ProjectDec17shuffle1_1030000 | DLC_resnet50_Picky_Pigeon_ProjectDec17shuffle1_1030000.1 | DLC_resnet50_Picky_Pigeon_ProjectDec17shuffle1_1030000.2 | DLC_resnet50_Picky_Pigeon_ProjectDec17shuffle1_1030000.3 | DLC_resnet50_Picky_Pigeon_ProjectDec17shuffle1_1030000.4 | DLC_resnet50_Picky_Pigeon_ProjectDec17shuffle1_1030000.5 | DLC_resnet50_Picky_Pigeon_ProjectDec17shuffle1_1030000.6 | DLC_resnet50_Picky_Pigeon_ProjectDec17shuffle1_1030000.7 | DLC_resnet50_Picky_Pigeon_ProjectDec17shuffle1_1030000.8 | DLC_resnet50_Picky_Pigeon_ProjectDec17shuffle1_1030000.9 | DLC_resnet50_Picky_Pigeon_ProjectDec17shuffle1_1030000.10 | DLC_resnet50_Picky_Pigeon_ProjectDec17shuffle1_1030000.11 | DLC_resnet50_Picky_Pigeon_ProjectDec17shuffle1_1030000.12 | DLC_resnet50_Picky_Pigeon_ProjectDec17shuffle1_1030000.13 | DLC_resnet50_Picky_Pigeon_ProjectDec17shuffle1_1030000.14 | DLC_resnet50_Picky_Pigeon_ProjectDec17shuffle1_1030000.15 | DLC_resnet50_Picky_Pigeon_ProjectDec17shuffle1_1030000.16 | DLC_resnet50_Picky_Pigeon_ProjectDec17shuffle1_1030000.17 | |
|---|---|---|---|---|---|---|---|---|---|---|---|---|---|---|---|---|---|---|---|
| 0 | bodyparts | tophead | tophead | tophead | neckbase | neckbase | neckbase | tailend | tailend | tailend | wingbowleft | wingbowleft | wingbowleft | wingbowright | wingbowright | wingbowright | backcenter | backcenter | backcenter |
| 1 | coords | x | y | likelihood | x | y | likelihood | x | y | likelihood | x | y | likelihood | x | y | likelihood | x | y | likelihood |
| 2 | 0 | 736.8365478515625 | 440.2051086425781 | 0.9999855756759644 | 736.7742309570312 | 521.3764038085938 | 0.9882965683937073 | 855.1517944335938 | 502.51654052734375 | 0.9929274916648865 | 722.4508666992188 | 638.5551147460938 | 0.9817160964012146 | 848.135498046875 | 725.8486328125 | 0.5518141388893127 | 779.173828125 | 637.4671020507812 | 0.9575235247612 |
| 3 | 1 | 736.6965732465003 | 439.96420420329684 | 0.9999710321426392 | 736.6901676790957 | 521.3737120583947 | 0.9984785914421082 | 854.1960618426 | 497.6001401711765 | 0.041485220193862915 | 717.9101631977412 | 636.903006227701 | 0.9891084432601929 | 843.8478180157791 | 722.9210467101142 | 0.8639070987701416 | 777.0301382784822 | 636.5131135081384 | 0.9471402168273926 |
| 4 | 2 | 735.7040493627546 | 436.7637389370659 | 0.999962568283081 | 736.6576001497499 | 520.317367317496 | 0.9994844198226929 | 855.3453658338591 | 630.6766258156872 | 0.0038163603749126196 | 718.9731625027971 | 637.8714981367024 | 0.9381800889968872 | 709.894219318126 | 604.0449981131718 | 0.14082202315330505 | 777.3939321502603 | 636.2873536219506 | 0.9269355535507202 |
| ... | ... | ... | ... | ... | ... | ... | ... | ... | ... | ... | ... | ... | ... | ... | ... | ... | ... | ... | ... |
| 71921 | 71919 | 816.685736 | 394.333402 | 0.996886 | 747.200637 | 430.753285 | 0.99992 | 575.128539 | 563.851408 | 0.999976 | 756.409661 | 354.888011 | 0.999997 | 816.141309 | 446.039971 | 0.999989 | 672.113405 | 479.530765 | 0.999961 |
| 71922 | 71920 | 816.844076 | 394.197315 | 0.993028 | 747.467628 | 430.599931 | 0.999918 | 575.047661 | 564.093645 | 0.999984 | 756.498965 | 354.752492 | 0.999998 | 816.132225 | 445.987682 | 0.999973 | 672.046608 | 479.611423 | 0.999972 |
| 71923 | 71921 | 816.824561 | 393.841141 | 0.991949 | 747.3541 | 430.614478 | 0.999922 | 575.211231 | 564.088919 | 0.999988 | 756.520165 | 354.817808 | 0.999998 | 815.87947 | 446.139886 | 0.99998 | 672.175552 | 479.673533 | 0.999959 |
| 71924 | 71922 | 816.406188 | 393.766398 | 0.992734 | 747.626257 | 430.654457 | 0.999948 | 575.462232 | 564.156158 | 0.999987 | 756.487524 | 354.854141 | 0.999997 | 815.797104 | 446.552003 | 0.999989 | 672.213608 | 479.578535 | 0.999954 |
| 71925 | 71923 | 816.119821 | 393.876178 | 0.993627 | 747.240035 | 430.915333 | 0.999949 | 575.500692 | 563.874192 | 0.999987 | 756.474672 | 354.848543 | 0.999998 | 815.629617 | 446.596012 | 0.999986 | 672.112326 | 479.64037 | 0.999971 |
71926 rows × 19 columns
You can specify multiple headers in pd.read_csv(file, header=[0,1,2]), but your data frame will be a little more difficult to subset, as columns will be a MultiIndex array.
data = pd.read_csv(file, header=[0, 1, 2])
data
| scorer | DLC_resnet50_Picky_Pigeon_ProjectDec17shuffle1_1030000 | ||||||||||||||||||
|---|---|---|---|---|---|---|---|---|---|---|---|---|---|---|---|---|---|---|---|
| bodyparts | tophead | neckbase | tailend | wingbowleft | wingbowright | backcenter | |||||||||||||
| coords | x | y | likelihood | x | y | likelihood | x | y | likelihood | x | y | likelihood | x | y | likelihood | x | y | likelihood | |
| 0 | 0 | 736.836548 | 440.205109 | 0.999986 | 736.774231 | 521.376404 | 0.988297 | 855.151794 | 502.516541 | 0.992927 | 722.450867 | 638.555115 | 0.981716 | 848.135498 | 725.848633 | 0.551814 | 779.173828 | 637.467102 | 0.957524 |
| 1 | 1 | 736.696573 | 439.964204 | 0.999971 | 736.690168 | 521.373712 | 0.998479 | 854.196062 | 497.600140 | 0.041485 | 717.910163 | 636.903006 | 0.989108 | 843.847818 | 722.921047 | 0.863907 | 777.030138 | 636.513114 | 0.947140 |
| 2 | 2 | 735.704049 | 436.763739 | 0.999963 | 736.657600 | 520.317367 | 0.999484 | 855.345366 | 630.676626 | 0.003816 | 718.973163 | 637.871498 | 0.938180 | 709.894219 | 604.044998 | 0.140822 | 777.393932 | 636.287354 | 0.926936 |
| 3 | 3 | 734.293249 | 431.819332 | 0.999991 | 735.908934 | 517.310811 | 0.998731 | 827.010097 | 675.563420 | 0.004858 | 721.308479 | 640.070535 | 0.857882 | 796.094113 | 682.185972 | 0.460554 | 777.985463 | 635.496588 | 0.972686 |
| 4 | 4 | 732.744517 | 426.053270 | 0.999990 | 735.196591 | 513.924565 | 0.999366 | 791.315112 | 546.063109 | 0.032099 | 723.677384 | 638.630865 | 0.999613 | 811.859656 | 696.591080 | 0.586390 | 779.552232 | 633.139890 | 0.991626 |
| ... | ... | ... | ... | ... | ... | ... | ... | ... | ... | ... | ... | ... | ... | ... | ... | ... | ... | ... | ... |
| 71919 | 71919 | 816.685736 | 394.333402 | 0.996886 | 747.200637 | 430.753285 | 0.999920 | 575.128539 | 563.851408 | 0.999976 | 756.409661 | 354.888011 | 0.999997 | 816.141309 | 446.039971 | 0.999989 | 672.113405 | 479.530765 | 0.999961 |
| 71920 | 71920 | 816.844076 | 394.197315 | 0.993028 | 747.467628 | 430.599931 | 0.999918 | 575.047661 | 564.093645 | 0.999984 | 756.498965 | 354.752492 | 0.999998 | 816.132225 | 445.987682 | 0.999973 | 672.046608 | 479.611423 | 0.999972 |
| 71921 | 71921 | 816.824561 | 393.841141 | 0.991949 | 747.354100 | 430.614478 | 0.999922 | 575.211231 | 564.088919 | 0.999988 | 756.520165 | 354.817808 | 0.999998 | 815.879470 | 446.139886 | 0.999980 | 672.175552 | 479.673533 | 0.999959 |
| 71922 | 71922 | 816.406188 | 393.766398 | 0.992734 | 747.626257 | 430.654457 | 0.999948 | 575.462232 | 564.156158 | 0.999987 | 756.487524 | 354.854141 | 0.999997 | 815.797104 | 446.552003 | 0.999989 | 672.213608 | 479.578535 | 0.999954 |
| 71923 | 71923 | 816.119821 | 393.876178 | 0.993627 | 747.240035 | 430.915333 | 0.999949 | 575.500692 | 563.874192 | 0.999987 | 756.474672 | 354.848543 | 0.999998 | 815.629617 | 446.596012 | 0.999986 | 672.112326 | 479.640370 | 0.999971 |
71924 rows × 19 columns
data.columns
MultiIndex([(                                                'scorer', ...),
            ('DLC_resnet50_Picky_Pigeon_ProjectDec17shuffle1_1030000', ...),
            ('DLC_resnet50_Picky_Pigeon_ProjectDec17shuffle1_1030000', ...),
            ('DLC_resnet50_Picky_Pigeon_ProjectDec17shuffle1_1030000', ...),
            ('DLC_resnet50_Picky_Pigeon_ProjectDec17shuffle1_1030000', ...),
            ('DLC_resnet50_Picky_Pigeon_ProjectDec17shuffle1_1030000', ...),
            ('DLC_resnet50_Picky_Pigeon_ProjectDec17shuffle1_1030000', ...),
            ('DLC_resnet50_Picky_Pigeon_ProjectDec17shuffle1_1030000', ...),
            ('DLC_resnet50_Picky_Pigeon_ProjectDec17shuffle1_1030000', ...),
            ('DLC_resnet50_Picky_Pigeon_ProjectDec17shuffle1_1030000', ...),
            ('DLC_resnet50_Picky_Pigeon_ProjectDec17shuffle1_1030000', ...),
            ('DLC_resnet50_Picky_Pigeon_ProjectDec17shuffle1_1030000', ...),
            ('DLC_resnet50_Picky_Pigeon_ProjectDec17shuffle1_1030000', ...),
            ('DLC_resnet50_Picky_Pigeon_ProjectDec17shuffle1_1030000', ...),
            ('DLC_resnet50_Picky_Pigeon_ProjectDec17shuffle1_1030000', ...),
            ('DLC_resnet50_Picky_Pigeon_ProjectDec17shuffle1_1030000', ...),
            ('DLC_resnet50_Picky_Pigeon_ProjectDec17shuffle1_1030000', ...),
            ('DLC_resnet50_Picky_Pigeon_ProjectDec17shuffle1_1030000', ...),
            ('DLC_resnet50_Picky_Pigeon_ProjectDec17shuffle1_1030000', ...)],
           )
data.columns.get_level_values(1)
Index(['bodyparts', 'tophead', 'tophead', 'tophead', 'neckbase', 'neckbase',
       'neckbase', 'tailend', 'tailend', 'tailend', 'wingbowleft',
       'wingbowleft', 'wingbowleft', 'wingbowright', 'wingbowright',
       'wingbowright', 'backcenter', 'backcenter', 'backcenter'],
      dtype='object')
data.columns.get_level_values(2)
Index(['coords', 'x', 'y', 'likelihood', 'x', 'y', 'likelihood', 'x', 'y',
       'likelihood', 'x', 'y', 'likelihood', 'x', 'y', 'likelihood', 'x', 'y',
       'likelihood'],
      dtype='object')
Better rename the columns of your data frame to avoid MultiIndex
data.columns.get_level_values(1) + '_' + data.columns.get_level_values(1)
Index(['bodyparts_bodyparts', 'tophead_tophead', 'tophead_tophead',
       'tophead_tophead', 'neckbase_neckbase', 'neckbase_neckbase',
       'neckbase_neckbase', 'tailend_tailend', 'tailend_tailend',
       'tailend_tailend', 'wingbowleft_wingbowleft', 'wingbowleft_wingbowleft',
       'wingbowleft_wingbowleft', 'wingbowright_wingbowright',
       'wingbowright_wingbowright', 'wingbowright_wingbowright',
       'backcenter_backcenter', 'backcenter_backcenter',
       'backcenter_backcenter'],
      dtype='object')
new_col_names = list(data.columns.get_level_values(
    1) + '_' + data.columns.get_level_values(2))
data.columns = new_col_names
data
| bodyparts_coords | tophead_x | tophead_y | tophead_likelihood | neckbase_x | neckbase_y | neckbase_likelihood | tailend_x | tailend_y | tailend_likelihood | wingbowleft_x | wingbowleft_y | wingbowleft_likelihood | wingbowright_x | wingbowright_y | wingbowright_likelihood | backcenter_x | backcenter_y | backcenter_likelihood | |
|---|---|---|---|---|---|---|---|---|---|---|---|---|---|---|---|---|---|---|---|
| 0 | 0 | 736.836548 | 440.205109 | 0.999986 | 736.774231 | 521.376404 | 0.988297 | 855.151794 | 502.516541 | 0.992927 | 722.450867 | 638.555115 | 0.981716 | 848.135498 | 725.848633 | 0.551814 | 779.173828 | 637.467102 | 0.957524 |
| 1 | 1 | 736.696573 | 439.964204 | 0.999971 | 736.690168 | 521.373712 | 0.998479 | 854.196062 | 497.600140 | 0.041485 | 717.910163 | 636.903006 | 0.989108 | 843.847818 | 722.921047 | 0.863907 | 777.030138 | 636.513114 | 0.947140 |
| 2 | 2 | 735.704049 | 436.763739 | 0.999963 | 736.657600 | 520.317367 | 0.999484 | 855.345366 | 630.676626 | 0.003816 | 718.973163 | 637.871498 | 0.938180 | 709.894219 | 604.044998 | 0.140822 | 777.393932 | 636.287354 | 0.926936 |
| 3 | 3 | 734.293249 | 431.819332 | 0.999991 | 735.908934 | 517.310811 | 0.998731 | 827.010097 | 675.563420 | 0.004858 | 721.308479 | 640.070535 | 0.857882 | 796.094113 | 682.185972 | 0.460554 | 777.985463 | 635.496588 | 0.972686 |
| 4 | 4 | 732.744517 | 426.053270 | 0.999990 | 735.196591 | 513.924565 | 0.999366 | 791.315112 | 546.063109 | 0.032099 | 723.677384 | 638.630865 | 0.999613 | 811.859656 | 696.591080 | 0.586390 | 779.552232 | 633.139890 | 0.991626 |
| ... | ... | ... | ... | ... | ... | ... | ... | ... | ... | ... | ... | ... | ... | ... | ... | ... | ... | ... | ... |
| 71919 | 71919 | 816.685736 | 394.333402 | 0.996886 | 747.200637 | 430.753285 | 0.999920 | 575.128539 | 563.851408 | 0.999976 | 756.409661 | 354.888011 | 0.999997 | 816.141309 | 446.039971 | 0.999989 | 672.113405 | 479.530765 | 0.999961 |
| 71920 | 71920 | 816.844076 | 394.197315 | 0.993028 | 747.467628 | 430.599931 | 0.999918 | 575.047661 | 564.093645 | 0.999984 | 756.498965 | 354.752492 | 0.999998 | 816.132225 | 445.987682 | 0.999973 | 672.046608 | 479.611423 | 0.999972 |
| 71921 | 71921 | 816.824561 | 393.841141 | 0.991949 | 747.354100 | 430.614478 | 0.999922 | 575.211231 | 564.088919 | 0.999988 | 756.520165 | 354.817808 | 0.999998 | 815.879470 | 446.139886 | 0.999980 | 672.175552 | 479.673533 | 0.999959 |
| 71922 | 71922 | 816.406188 | 393.766398 | 0.992734 | 747.626257 | 430.654457 | 0.999948 | 575.462232 | 564.156158 | 0.999987 | 756.487524 | 354.854141 | 0.999997 | 815.797104 | 446.552003 | 0.999989 | 672.213608 | 479.578535 | 0.999954 |
| 71923 | 71923 | 816.119821 | 393.876178 | 0.993627 | 747.240035 | 430.915333 | 0.999949 | 575.500692 | 563.874192 | 0.999987 | 756.474672 | 354.848543 | 0.999998 | 815.629617 | 446.596012 | 0.999986 | 672.112326 | 479.640370 | 0.999971 |
71924 rows × 19 columns
What does my data tell me?#
# Does this make sense?
coords.mean(axis='columns')
0     -19.892839
1     -19.914494
2     -19.930776
3     -19.937752
4     -19.923985
         ...
445    -6.321469
446    -6.313084
447    -6.304621
448    -6.296241
449    -6.288533
Length: 450, dtype: float64
# What about this?
coords.mean(axis='index')
lefteye1_x     18.106572
lefteye1_y     -0.019333
lefteye1_z      0.796235
lefteye2_x     43.672666
lefteye2_y     -0.645574
                 ...
rlip_y          0.996420
rlip_z        -74.329763
chin_x         17.394544
chin_y         -0.286453
chin_z       -118.842049
Length: 63, dtype: float64
coords['lefteye1_x'].mean()
18.10657168922479
coords.describe()
| lefteye1_x | lefteye1_y | lefteye1_z | lefteye2_x | lefteye2_y | lefteye2_z | righteye1_x | righteye1_y | righteye1_z | righteye2_x | ... | lowlip_z | llip_x | llip_y | llip_z | rlip_x | rlip_y | rlip_z | chin_x | chin_y | chin_z | |
|---|---|---|---|---|---|---|---|---|---|---|---|---|---|---|---|---|---|---|---|---|---|
| count | 450.000000 | 450.000000 | 450.000000 | 450.000000 | 450.000000 | 450.000000 | 450.000000 | 450.000000 | 450.000000 | 450.000000 | ... | 450.000000 | 450.000000 | 450.000000 | 450.000000 | 450.000000 | 450.000000 | 450.000000 | 450.000000 | 450.000000 | 450.000000 |
| mean | 18.106572 | -0.019333 | 0.796235 | 43.672666 | -0.645574 | 5.586992 | -21.632261 | 1.278443 | -6.218734 | -44.885085 | ... | -77.892073 | 36.387709 | -0.794339 | -65.950381 | -14.813016 | 0.996420 | -74.329763 | 17.394544 | -0.286453 | -118.842049 |
| std | 11.434284 | 0.599469 | 3.828957 | 11.505354 | 0.705344 | 4.144886 | 12.124253 | 0.803002 | 4.433668 | 11.226158 | ... | 6.383489 | 12.088332 | 0.708887 | 5.909938 | 12.327903 | 0.705005 | 5.116139 | 11.669450 | 0.823316 | 3.496960 |
| min | -18.098617 | -1.145164 | -6.844781 | 5.858257 | -1.948370 | -2.307151 | -57.526330 | -1.012775 | -18.430021 | -81.767449 | ... | -89.068969 | 0.151487 | -2.103737 | -76.193362 | -50.004844 | -0.675003 | -84.866708 | -17.538646 | -1.985098 | -125.301249 |
| 25% | 18.225435 | -0.612380 | -2.954008 | 43.193416 | -1.344781 | 2.123240 | -22.683956 | 0.584199 | -10.600334 | -45.410591 | ... | -83.604016 | 33.761567 | -1.246099 | -70.754029 | -16.660826 | 0.725735 | -78.226643 | 15.961120 | -1.119348 | -121.885470 |
| 50% | 19.861041 | -0.047041 | 0.653475 | 46.836783 | -0.575274 | 5.330278 | -18.695114 | 1.352917 | -6.413949 | -42.622488 | ... | -77.400903 | 39.924777 | -0.819950 | -67.125851 | -12.696178 | 1.048074 | -74.785135 | 18.953581 | -0.140253 | -117.925277 |
| 75% | 24.614006 | 0.572676 | 3.737492 | 48.943208 | -0.011691 | 8.761392 | -15.253385 | 1.890220 | -3.227924 | -39.535513 | ... | -72.539818 | 43.852962 | -0.265885 | -63.012012 | -10.172126 | 1.509309 | -71.510924 | 24.541857 | 0.266672 | -115.933453 |
| max | 34.449984 | 0.968391 | 8.652052 | 60.024778 | 0.420347 | 14.328102 | -5.669487 | 2.681084 | 2.781161 | -28.287430 | ... | -64.906500 | 53.732858 | 0.461475 | -54.243952 | 8.041773 | 2.103936 | -63.094976 | 34.490673 | 0.977069 | -111.792641 |
8 rows × 63 columns
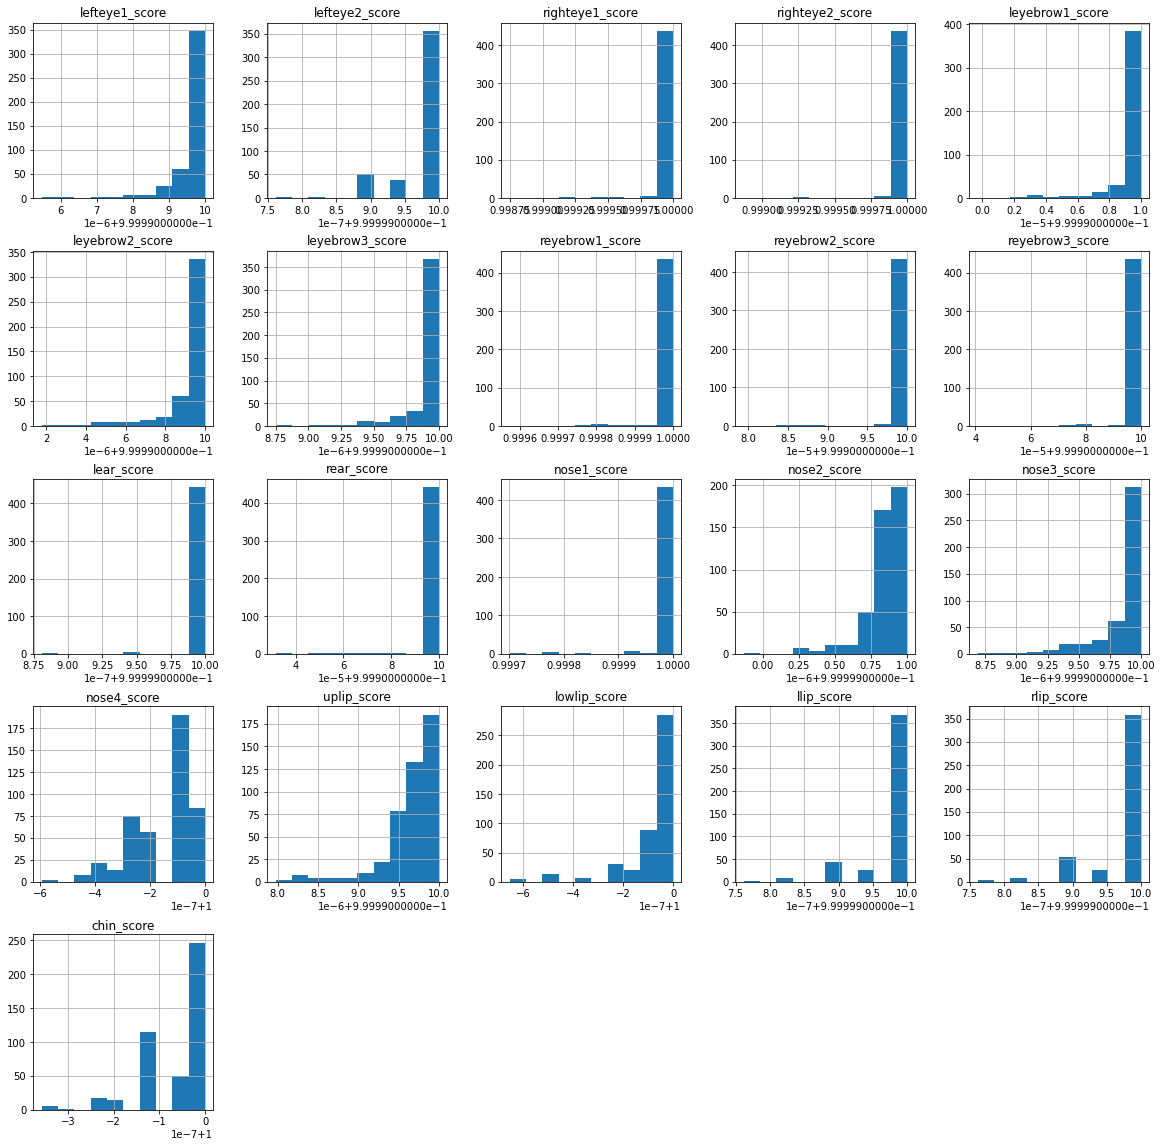
How could my data look like#
scores.hist(figsize=(20, 20))
array([[<AxesSubplot:title={'center':'lefteye1_score'}>,
        <AxesSubplot:title={'center':'lefteye2_score'}>,
        <AxesSubplot:title={'center':'righteye1_score'}>,
        <AxesSubplot:title={'center':'righteye2_score'}>,
        <AxesSubplot:title={'center':'leyebrow1_score'}>],
       [<AxesSubplot:title={'center':'leyebrow2_score'}>,
        <AxesSubplot:title={'center':'leyebrow3_score'}>,
        <AxesSubplot:title={'center':'reyebrow1_score'}>,
        <AxesSubplot:title={'center':'reyebrow2_score'}>,
        <AxesSubplot:title={'center':'reyebrow3_score'}>],
       [<AxesSubplot:title={'center':'lear_score'}>,
        <AxesSubplot:title={'center':'rear_score'}>,
        <AxesSubplot:title={'center':'nose1_score'}>,
        <AxesSubplot:title={'center':'nose2_score'}>,
        <AxesSubplot:title={'center':'nose3_score'}>],
       [<AxesSubplot:title={'center':'nose4_score'}>,
        <AxesSubplot:title={'center':'uplip_score'}>,
        <AxesSubplot:title={'center':'lowlip_score'}>,
        <AxesSubplot:title={'center':'llip_score'}>,
        <AxesSubplot:title={'center':'rlip_score'}>],
       [<AxesSubplot:title={'center':'chin_score'}>, <AxesSubplot:>,
        <AxesSubplot:>, <AxesSubplot:>, <AxesSubplot:>]], dtype=object)
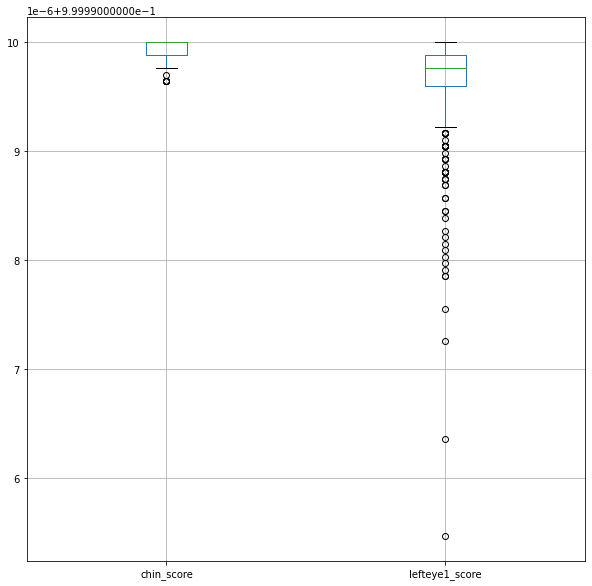
scores.boxplot(column=['chin_score', 'lefteye1_score'], figsize=(10, 10))
<AxesSubplot:>
x_coords = coords.loc[:, coords.columns.str.contains('_x')]
y_coords = coords.loc[:, coords.columns.str.contains('_y')]
z_coords = coords.loc[:, coords.columns.str.contains('_z')]
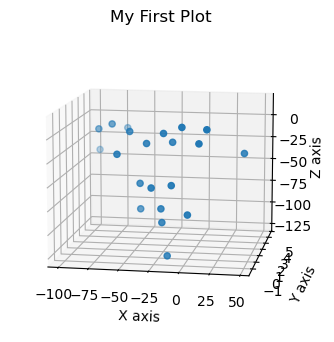
t = 0
fig = plt.figure(figsize=(6, 4), dpi=100)
ax = fig.add_subplot(projection='3d')
x_points = x_coords[t:t+1]
y_points = y_coords[t:t+1]
z_points = z_coords[t:t+1]
ax.scatter3D(x_points, y_points, z_points)
ax.view_init(11, 280)
ax.set(xlabel='X axis', ylabel='Y axis', zlabel='Z axis')
plt.title("My First Plot")
Text(0.5, 0.92, 'My First Plot')
In the following section we will learn to calculate some easy kinematic features to better understand our data.
Bonus#
def face_skeleton(pose):
"""
The face_skeleton function defines a mesh skeleton by connecting the facial landmarks as defined below.
This function is directly passed to plot_3Dpose.
"""
skeletons = []
for n in range(len(pose)): # read out n_components from different poses
lefteye = [pose[n]['lefteye1_x'], pose[n]['lefteye2_x']], [
pose[n]['lefteye1_y'], pose[n]['lefteye2_y']], [pose[n]['lefteye1_z'], pose[n]['lefteye2_z']]
righteye = [pose[n]['righteye1_x'], pose[n]['righteye2_x']], [
pose[n]['righteye1_y'], pose[n]['righteye2_y']], [pose[n]['righteye1_z'], pose[n]['righteye2_z']]
leyebrow = [pose[n]['leyebrow1_x'], pose[n]['leyebrow2_x'], pose[n]['leyebrow3_x']], [pose[n]['leyebrow1_y'], pose[n]
['leyebrow2_y'], pose[n]['leyebrow3_y']], [pose[n]['leyebrow1_z'], pose[n]['leyebrow2_z'], pose[n]['leyebrow3_z']]
reyebrow = [pose[n]['reyebrow1_x'], pose[n]['reyebrow2_x'], pose[n]['reyebrow3_x']], [pose[n]['reyebrow1_y'], pose[n]
['reyebrow2_y'], pose[n]['reyebrow3_y']], [pose[n]['reyebrow1_z'], pose[n]['reyebrow2_z'], pose[n]['reyebrow3_z']]
nose = [pose[n]['nose1_x'], pose[n]['nose3_x'], pose[n]['nose2_x'], pose[n]['nose4_x'], pose[n]['nose1_x']], [pose[n]['nose1_y'], pose[n]['nose3_y'], pose[n]
['nose2_y'], pose[n]['nose4_y'], pose[n]['nose1_y']], [pose[n]['nose1_z'], pose[n]['nose3_z'], pose[n]['nose2_z'], pose[n]['nose4_z'], pose[n]['nose1_z']]
lips = [pose[n]['uplip_x'], pose[n]['llip_x'], pose[n]['lowlip_x'], pose[n]['rlip_x'], pose[n]['uplip_x']], [pose[n]['uplip_y'], pose[n]['llip_y'], pose[n]
['lowlip_y'], pose[n]['rlip_y'], pose[n]['uplip_y']], [pose[n]['uplip_z'], pose[n]['llip_z'], pose[n]['lowlip_z'], pose[n]['rlip_z'], pose[n]['uplip_z']]
face = [pose[n]['rear_x'], pose[n]['chin_x'], pose[n]['lear_x']], [pose[n]['rear_y'], pose[n]
['chin_y'], pose[n]['lear_y']], [pose[n]['rear_z'], pose[n]['chin_z'], pose[n]['lear_z']]
skeleton = lefteye, righteye, leyebrow, reyebrow, nose, lips, face
skeletons.append(skeleton)
return skeletons
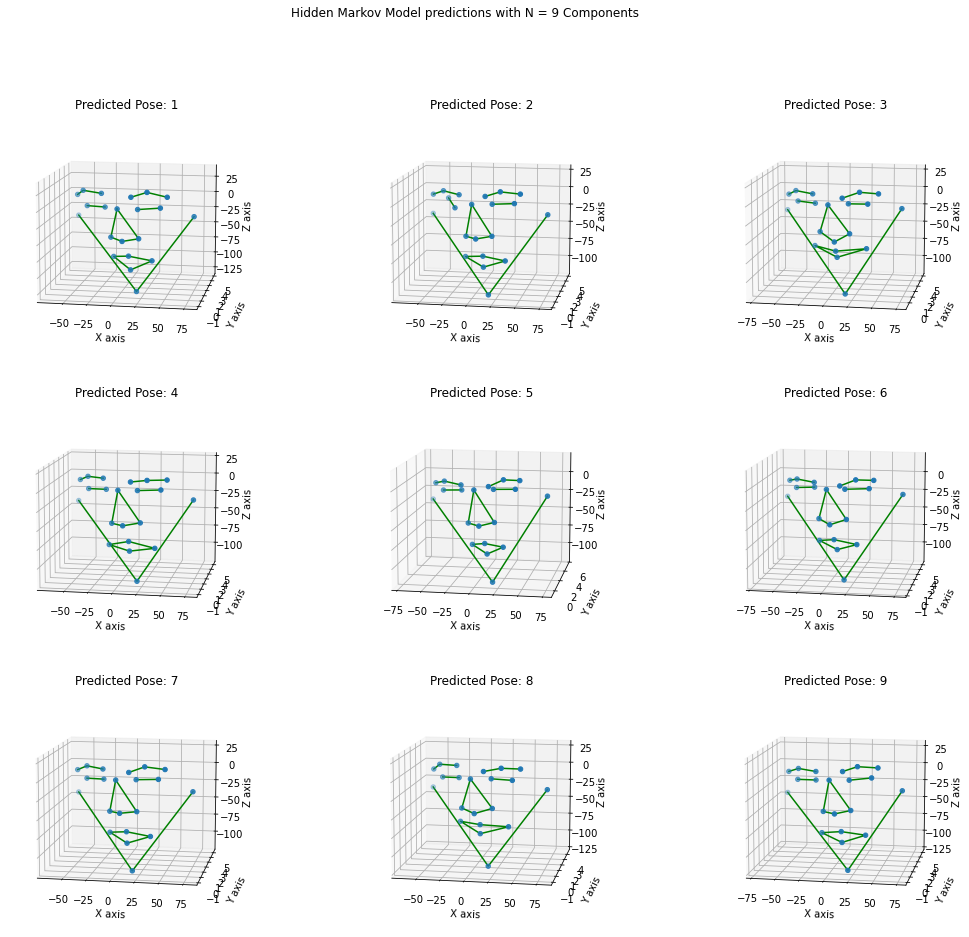
def plot_3Dpose(pose, elevation, azimuth):
"""
This plot function takes the average pose coordinates of facial landmarks, creates a skeleton and visualizes the facial expression
in a 3D coordinate system with predefined elevantion and azimuth angles.
"""
skeletons = face_skeleton(pose)
ncols = 3
nrows = math.ceil(len(pose)/ncols)
width = ncols*6
height = nrows * 5
fig, axes = plt.subplots(nrows, ncols, figsize=(
width, height), subplot_kw=dict(projection='3d'))
for ax, n in zip(axes.flat, range(len(pose))):
x_points = pose[n][['_x' in s for s in pose[n].index]]
y_points = pose[n][['_y' in s for s in pose[n].index]]
z_points = pose[n][['_z' in s for s in pose[n].index]]
ax.scatter3D(x_points, y_points, z_points)
ax.view_init(elevation, azimuth)
ax.set(xlabel='X axis', ylabel='Y axis', zlabel='Z axis')
ax.set_title('Predicted Pose: %d' % (n+1))
for i in range(len(skeletons[0])):
x = skeletons[n][i][0]
y = skeletons[n][i][1]
z = skeletons[n][i][2]
ax.plot(x, y, z, color='g')
plt.suptitle(
'Hidden Markov Model predictions with N = %d Components' % len(pose))
plt.show()
return
def split_data(data, prediction):
"""
The split_data function will be used to split time series data into smaller
chunks by the prediction variable.
"""
n = max(prediction)+1 # read out the number of predicted components
data['pred'] = prediction
grouped = data.groupby(data.pred)
predictions = [grouped.get_group(i) for i in range(n)]
pose = [predictions[i].mean() for i in range(n)]
return predictions, pose
from hmmlearn import hmm
import math
# change the number of components you expect to find in your data
model1 = hmm.GaussianHMM(n_components=9, covariance_type="full")
model1.fit(coords)
pred1 = model1.predict(coords)
_, pose1 = split_data(centered_coords, pred1)
plot_3Dpose(pose1, 11, 280)